I think we can all agree that 2021 was another year of great challenge and historic change. With that, also comes great opportunity. As we move into a new year, it’s natural to question what’s in store for the commercial real estate market in 2022. In this article, we will share the Twin Cities apartment market data from 2021 and give insights on what to expect in 2022. Let’s dive right in.
Apartment New Construction
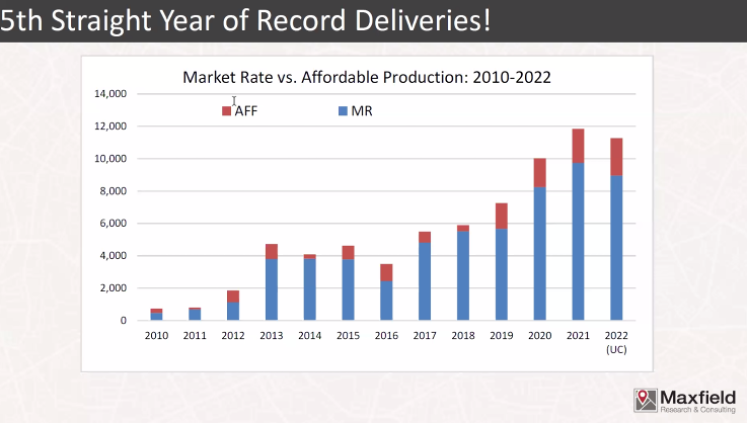
- 2021 was the fifth straight year of record apartment deliveries. There was a total of about 11,200 units built in the Minneapolis/St. Paul metropolitan area with about 80% market rate units and 20% affordable housing.

- In 2021, suburban apartment deliveries also surpassed Minneapolis and St. Paul cities by a large margin.

- New construction costs are reportedly up about 10% on average, or $20,000/unit more compared to 1 or 2 years ago.
- New Construction sales have been in the $250,000-$300,000 range. We will need to see rent growth to continue to justify new construction looking ahead.
Rent Growth
- The U.S. average rent growth exceeded 11%, Minneapolis/St. Paul metro area was at 3.6% in 2021. This puts the Twin Cities at the low end of the rent growth range for U.S. markets exceeding 75,000 units.
- There was no rent growth in 2020. Minnesota had exceeded the national average by about 30 basis points in three years prior to COVID-19.


Cap Rates
- Year 1 Cap Rate, tax adjusted – Class A, best of the best properties or new construction – High 3 to low 4%.
- New construction, 4 or 5 stories, suburban apartments- Cap rates were in the 4.5% and dipped to about 4.25% in 4th Quarter 2021.
- Cap rate spread in Class A and B, product has never been tighter. Can sell a 1980’s asset for 4.25% and then buy a newer product at similar rates.
- Class B products – about 4.5% cap rates, year 1, cap rate, tax adjusted rates. Makes Class A properties more attractive right now with cap rates so tight given less risk on cap ex requirements and superior mechanicals.
- Most panelists agreed the market will easily absorb a 25 basis points increase in interest rates. This may scare off a few people, but with so much capital chasing it won’t impact pricing.
- Some believe further cap rate compression will occur. The hunger for yield is here.
- Potential headwinds and things to consider
- Where is population growth coming from?
- Where is job growth coming from?
Rent Control
- The president of the Minnesota Housing Association shared market sentiment and concerns on the topic of rent control from the St. Paul policy that was passed in November 2021.
- Everyone wants certainty, St. Paul council members have heard the message loud and clear. Th policy starts May 1, 2022 and with 3.5 months to get there, the market is doubtful certainty will be reached by then. No changes to ordinance are allowed until November 2022.
- There are many challenges at this point. There is talk about a self-certification policy. The rent control order has very few clear definitions. Examples such as what constitutes rent – gross rent, net rent, RUBS, etc.
- The challenges in St. Paul are serving as a cautionary tale for Minneapolis.
- Rent control is now outside of the coastal cities and other non-coastal cities are worried.
2022 Twin Cities Apartment Market Trends
- Suburban Twin Cities properties strongly outperformed the urban properties
- Most sale transaction activity was in suburban markets and comprised of value-add or new construction properties.
- Twin Cities, while experiencing slower rent growth than other markets does offer higher cap rates and greater perceived stability than some of the southern U.S. cities.
- Heard several speakers say they anticipate Minneapolis proper will come roaring back – was dormant in 2021, particularly with sales.
- About $2.3 billion metro wide in 2021 sales activity. Several panelists anticipate 2022 levels to exceed that due to a lack of single-family affordable housing.
- Several brokers shared very strong demand exists from buyers.
- Will this strong market continue? Unless we see an interest rate spike, yes.
- Why is the market so strong?
- People are securing their real estate.
- It’s costing more every year to build.
- Viewed as an Inflation hedge.
- Lenders want to lend.
- Buyers want to buy.
- One example that was cited – The Cliffs of Minnetonka, with 456 units was listed for sale four days prior to the event. On first day offered to nation, had 75 confidentiality agreements signed first day and now over 100 CA’s signed.
- St. Paul is very slow at the moment – rent control is the hot topic and much remains to be discovered and needs to be clarified.
- Historically, 40% of sales are in Minneapolis and St. Paul. Right now, the ratio is 20% and remaining 80% are suburban sales. COVID cited as big driver of this factor.
- One broker anticipates seeing more sales of smaller 50-250 unit portfolios as labor costs rise and labor shortages persist.
Making the Most of 2022 Capital Markets Conditions
- Inflation is here. Took COVID to push inflationary pressures even higher.
- Rent control creates another risk factor for lenders. Some are seeing significant capital contraction in rent control markets. Rent control measures directly impact development and value-add.
- Lenders have pulled back or reduced appetite on lending in Minneapolis and St. Paul due to lack of clarity.
- One local lender, Bridgewater Bank, currently has several in-process construction projects. About 56% are located in Minneapolis and St. Paul. In early 2022, 10 projects have come thru pre-selection investment committee, only 1 out of 10 have been in Minneapolis and St. Paul. Points to shift in location to suburban locations. Pre-Covid, most everything was urban core.
- One positive is the strong median income of the Minneapolis/St. Paul metropolitan area. Much higher than many other southeast U.S. cities which have seen higher rent growth, but have lower incomes.
- Supply and demand fundamentals have resulted in strong multi-family appetite. The Twin Cities have delivered far fewer homes than needed over last decade. From 1992-2007, permits were authorized for an average of 1,687 housing units/month across the Twin Cities. Since 2008, the average has fallen to 1,077 permits per year.

