
Anyone who knows an appraiser recognizes the dynamics of being ‘data rich’ and ‘data wise’. Collecting and compiling ‘true comparable’ data allows us to dive deeper and to identify market trends to a greater degree. This month, we share insights, Simonson Appraisals authored charts, and graphs specific to the current Dollar Store net lease market. We promise, although we are appraisers and some might view us as dry and mundane, seeing the data spill into neat spreadsheets and reports get us excited!
Net Lease Markets
In the world of single-tenant commercial real estate one property type sub-group has stood out:
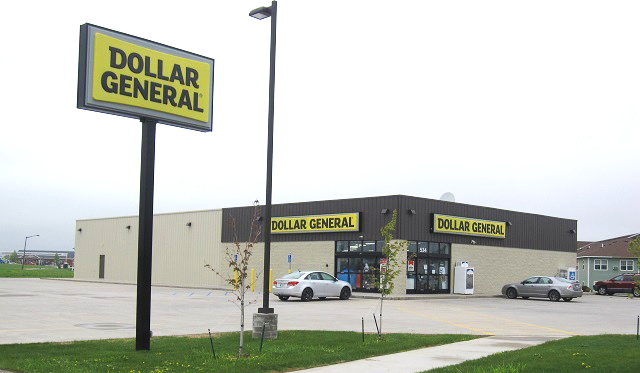
Dollar Stores
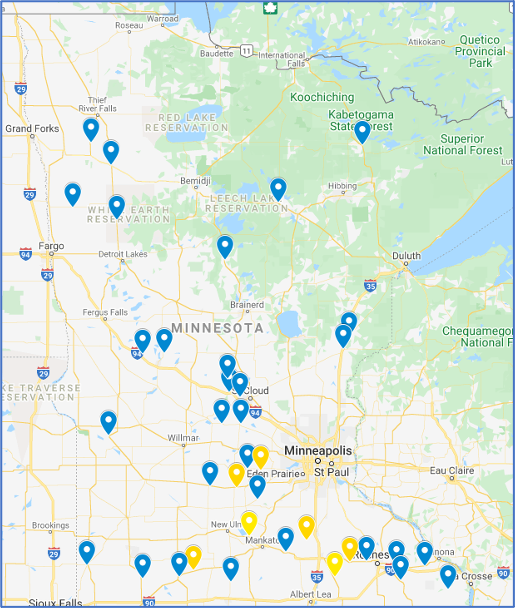
Over the past few years, Simonson Appraisals has provided valuations for many dollar store properties across Minnesota and North Dakota — primarily Dollar General. Below is a snapshot of several dollar store datapoints collected.
Dollar Store Net Lease Market Analysis
For every appraisal, a market analysis is performed to determine supply and demand factors and identify relevant market trends. For example, when a build-to-suit Dollar General store in small-town Minnesota is the subject of a valuation assignment, it is evident an overview of the National Net Lease markets is applicable as the buyer pool includes regional and national investors.
During 2020 even with COVID-19 uncertainties, there was a significant discussion nationally about investors pulling out of the stock market and an uptick in migration to ‘Amazon-proof’ real estate investments that had ‘essential’ tenants. Dollar Stores, including Dollar General leased properties fit this investor profile and led to greater demand for it specifically.
What are dynamics of a net lease investment property?
- Retail, office, medical or industrial uses can be either single-tenant or multi-tenant building
- Commitment to long-term lease (typically 10+ years with renewal options)
- Lease structure with most or all expenses and building repair responsibility of tenant
- Typically build-to-suit based on tenant needs and designs
Key Triple-Net Fundamentals Appraisers Recognize
- When cap rates decline, listing prices increase
- Cap rates are an inverse measure of risk
- Cap rates track Treasury interest rates
- Longer lease terms usually mean lower cap rates
- Tenant’s creditworthiness + lease term affects the cap rate
Dollar General Tenant Overview
Dollar General has been in growth mode for many years. Dollar General opened 1,000 new stores, remodeled 1,670 stores, relocated 110 stores and closed 101 units during the 52 weeks ended Jan. 29. Those totals were up across the board from fiscal 2019, when the deep value retailer opened 975 new locations, remodeled 1,024 units, relocated 100 units and closed 67 stores.
At the top line, fiscal 2020 net sales jumped 21.6% to $33.75 billion from $27.75 billion a year earlier, fueled by a sales lift from new stores and comparable-store sales growth. Dollar General noted that changes in shopper behavior triggered by COVID-19 had a “significant positive effect” on net and same-store sales in fiscal 2020.
The following table summarizes Dollar General corporate details:

Dollar General Tenant Lease Terms
Of the data we have reviewed, a new Dollar General store typically has a signed 15-year corporate guaranteed lease at a flat rate. Additionally, provisions include four or five, 5-year options to extend the lease with base rent increases of 10% for each option period.
From a national perspective, according to Boulder Group, 2nd Quarter 2020 Net Lease Dollar Store Report, the average rent is $98,000 annually and the average sale price is $1,350,000. Whereas our smaller pool of data for Minnesota that covers the same period indicates the average rent is $84,648 annually and the average sale price is $1,250,398.
Rental Rate Trends
The main drivers in rental rates are traffic count, population in the surrounding area, and household income. 70% of Dollar General stores are located in towns of 20,000 people or less, and the majority of the stores have one- and three-mile populations of 5,000 or less. We recognize these attributes places challenges on deriving adjustments for change in market conditions.
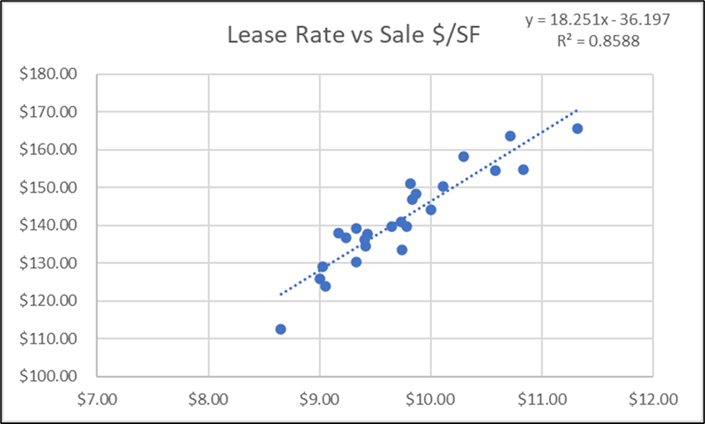
Our solution combines statistical analysis of the data we’ve compiled through careful study of the relationships to lend support for our conclusions. For example, the chart below displays the relationship between lease rates and sale prices from our broader data set going back to 2016.
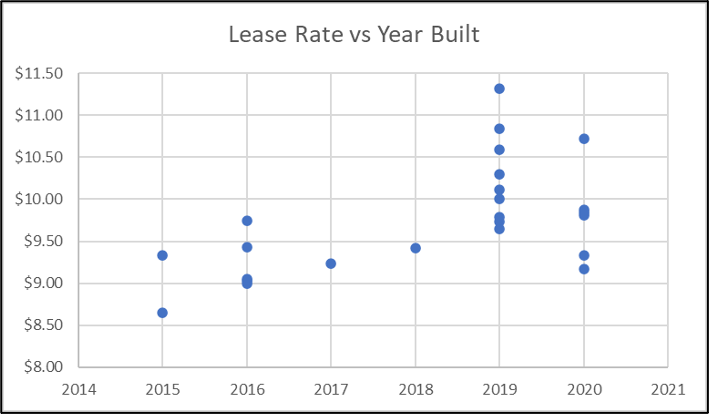
Similarly, the below chart of build dates compared to rental rates lends secondary support for our conclusions. This graph although a smaller subset of the scatter graph above provides greater insight into the leveling off and slight dip in rents for 2020 build on dates. We find the charts give greater detail that’s more easily understood than words alone could present.
Location, Location, Location
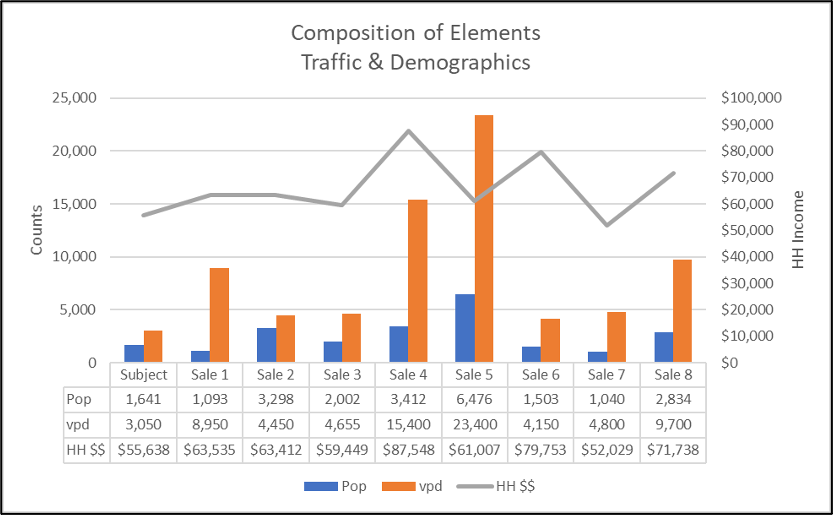
Considering the typical build-to-suit Dollar Generals have very specific parameters for their store locations and those locations are strewn across the state, we find it’s more realistic to investigate the composition of elements that impact location on a relative comparison basis utilizing a chart for comparison as shown following. We favor this type of analysis as the parameters have only slight variations that come from the demographics and locations within their small-town target locations.
For example, in the chart below we display the estimated population level, traffic volume and household income for the subject property and comparables. We use the chart to provide support for our location adjustment deemed applicable.
Capitalization Rate Trends
We also study capitalization rate trends both nationally and regionally state-wide. This includes review of national reports combined with statistical analysis of our data pool as well as dialed into the subject via select comparables. Additionally, we supplement this deep dive into research with market participant interviews.
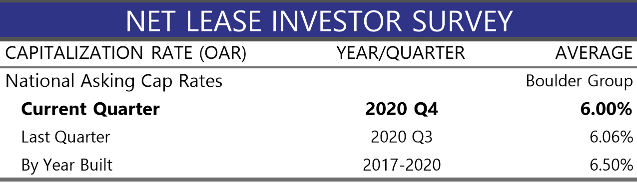
National Survey
Below is an example of data pertaining to investment grade properties (source: Boulder Group).
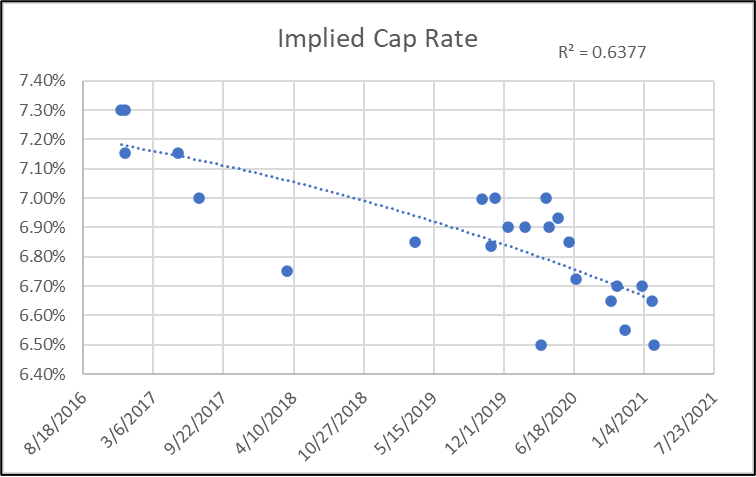
Simonson Appraisals Data Pool
As shown in the scatter graph below, for several years, cap rates for solid net lease investment properties have been declining. The market impacts of COVID have also affected property types differently. It has created winners and losers (essential vs. non-essential). Single tenant net leased retail properties such as Dollar General who are viewed as ‘essential’ have remained in favor and this trend is anticipated to continue.
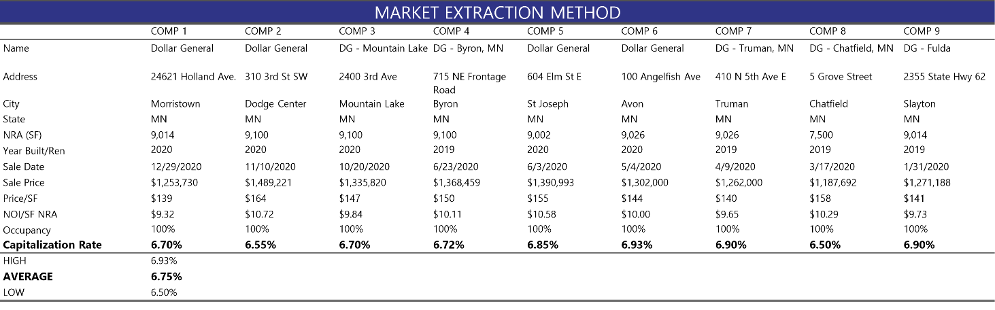
Market Extraction
The table following details ten capitalization rates extracted from the market. The sales closed between January 2020 and December 2020. The above combined with the below lend support for our conclusions that are supplemented further with direct market interviews.
Market Research
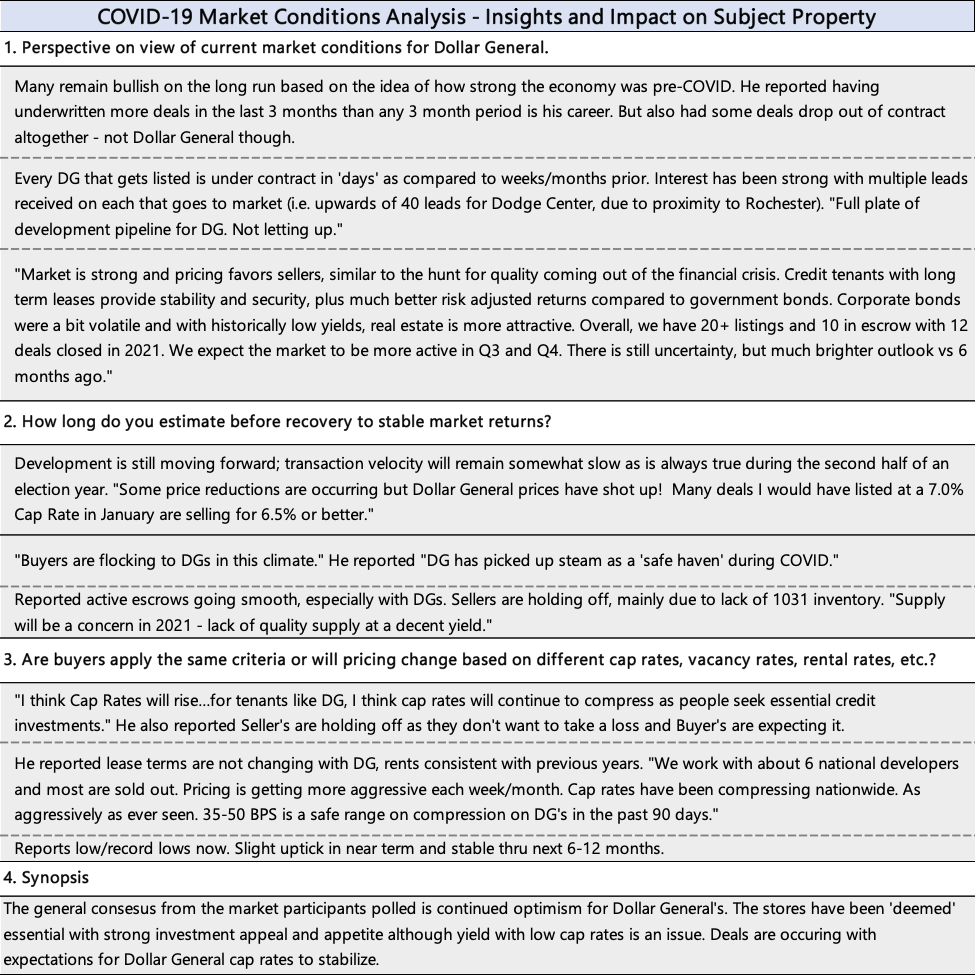
As part of our market research, we intentionally reach out to knowledgeable nationally based real estate brokers who handle a large volume of Dollar General transactions to get their thoughts, perspectives and opinions. The table following presents what these market experts shared directly from interviews conducted July 2020 to March 2021:
Concluding Thoughts
There are multiple methods to complete a valuation assignment and present the results. In most instances from feedback we hear, charts, graphs, and diagrams aid the reader and make for a more pleasant presentation. We tend to agree.
Mitchell Simonson, Founder, Simonson Appraisals
With a wide range of commercial appraisal experience and real estate consulting, Mitchell Simonson’s 17 years of experience, knowledge, and ‘boots on the ground’ attitude are invaluable assets that have helped countless clients make smart business decisions. As owner and founder of Simonson Appraisals, he leads the firm in delivering credible valuation services for financial institutions and attorneys specializing in the areas of condemnation, property tax appeal and estate planning.
Marlo Headrick, Associate, Simonson Appraisals
Ms. Headrick has been in the commercial real estate appraisal industry since 2009 following a long and satisfying career in a science-based discipline. She has completed valuations for condemnation, estate planning, financing, donations and insurance purposes. She is an approved panel appraiser for NDDOT and WisDOT and nearing completion as a Candidate for Designation, Appraisal Institute (anticipated 2021).
I appraise lots of new-construction DGs that are often under contract prior to completion of the improvements. We are currently appraising a DG that is trading at a 5.48% cap rate and in my research to see if that is supported, and confirm our perception of the continued compression in DG cap rates, I ran across this article. Very well written!